Great graphic from the Energy Information Administration:
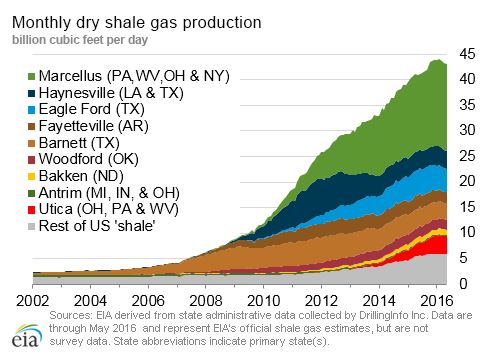
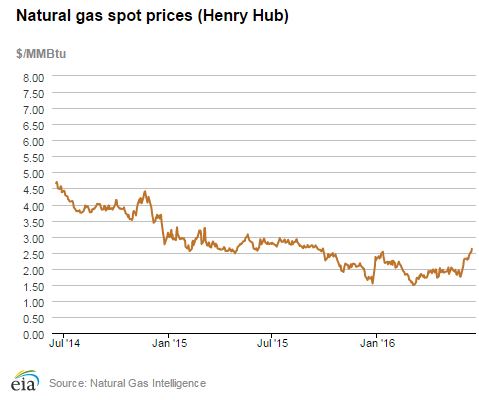
It’s amazing how production has held up and even increased despite low gas prices. Production declines have shown up only at the beginning of this year, even though prices have been below $3.00 since January 2015.